Cumulative Performance

The cumulative performance of an investment is the total percentage movement in the price of the asset over the whole of any specified period, be it one/three/five years for example, or since an investment commenced. You may also see this expressed as growth of a hypothetical $10,000, where the end value represents what that initial investment would now be worth. The calculation of cumulative performance for funds generally uses total returns, with dividends reinvested.
Cumulative performance can be useful as an indication as to what an investment has or would have achieved for you in real terms over a period. You will find this indication of results on a Fund Factsheet, along with discrete performance and annualised performance, as the main measures of a fund’s results.
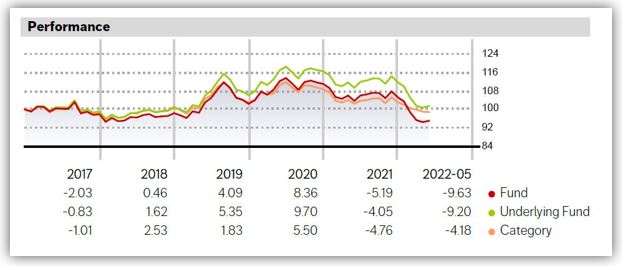
Cumulative performance is often visualised as a line chart, such as the example below taken from a fund factsheet on our online fund centre, often with a comparison against a Morningstar category, a benchmark, or an index:
It's important to note that performance includes the funds own management charges but excludes any product-specific related charges.
Past performance may not be repeated and should not be used as a guide to future performance.